R - Squared
Remember: To find the line of best fit for a simple linear regression is SUM(y - ŷᵢ )² and we say that this is equal to the Sum of Squares of Residuals ().
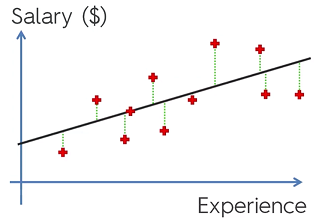
() = SUM(y - ŷᵢ )²
Now, instead of taking the line of best fit. Imagine drawing a line to represent the average of ‘y’. This line can be found with the formula SUM(yᵢ - )² and is less than or equal to the total sum of squares ().
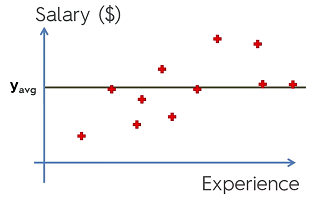
= SUM(yᵢ - )²
R-Squared is:
R² = 1 - /
R squared tells us how good our line is compared to the average line. Ideal scenario is that R² is equal to 1 or is 0.
Adjusted R Squared
–> MIN R² : Goodness of fit
Problem: Adding variables
R² will never decrease by adding a new variable. This is because the regression model will try and minimize SSres. Even if we cannot do so, it can make the ‘b’ coefficient 0. However, this will likely never happen since the model will find a very small correlation between the independent variable and the dependent variable and make ‘b’ slightly greater than zero. Even though there is no actual correlation. This is a problem because we can’t know if a independent variable actually has a correlation or not. And so this means that there is bias because it will always try and make R² larger.
To solve this we use adjusted R Squared with the formula
Adj R² = 1 (1- R²) (n-1)/(n - p -1) p: # of regressors n: sample size
When adding regressors to the model p increases and when the bottom of the equation increases, the ratio will increase. This means that adj R squared has penalizing factor that makes it so that adding independent variables that don’t help your model will instead hurt it.
Linear Regression Coefficients
Magnitude: The size has no direct relationship to the impact of that coefficient. Var 1 has mag = 5
Var 2 has mag = 2
Dependent var mag = 30
Increasing either variable will increase the dependent variable, however increasing Var 1 by 5 won’t have a greater impact than if you did the same with Var 2 necessarily.
The correct way to determine the impact from the magnitude is to make sure to look at the independent variables in terms of the same unit as the dependent variable. We can say that per unit of Var 1 your dependent variable will increase by 5 units.